-4.png?width=500&height=115&name=6789782.fs1.hubspotusercontent-na1.nethubfs6789782Product%20logosDatapharm_RGB_Logo1%20(3)-4.png)
You can customise your results by using the filters on the top of the page. After selecting your filter, click elsewhere on the report for the filter menu to close.
The following 3 filters are common on every report and, when used, will apply to each of your reports within emc analytics:
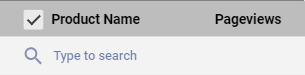
Product Name
All your company products are included in the reports by default. The filters allow the selection of a single value or multiple values to allow the viewing of subsets of data. The ‘search’ bar within the filters provides an easy way to find the values you want to include.
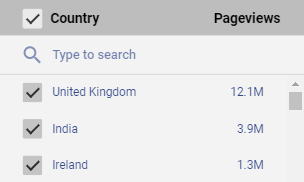
Country
All countries are included in the reports by default. The filters allow the selection of a single value or multiple values to allow the viewing of subsets of data. The ‘search’ bar within the filters provides an easy way to find the values you want to include.
Date filter
This is set to the last 28 days' worth of data by default 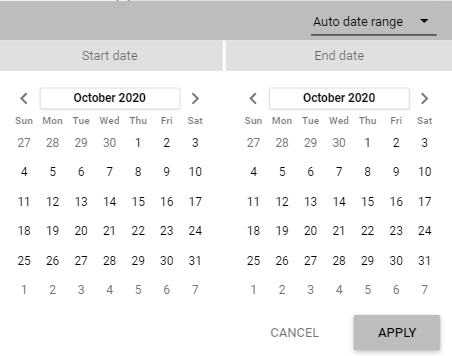
To retain the chosen top-level filter selections, navigate between all reports, except the RMM Downloads report, by using the grey navigation bar at the bottom of the report.
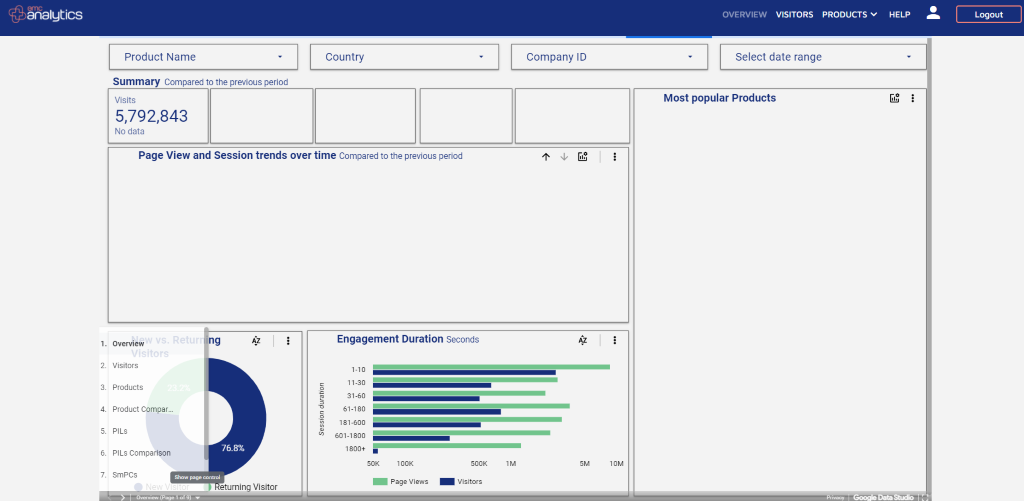
Using the header menu options to navigate between the reports will reset all filters.
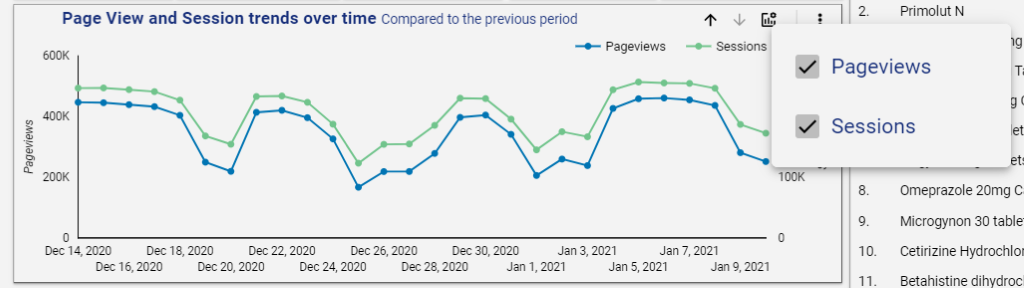
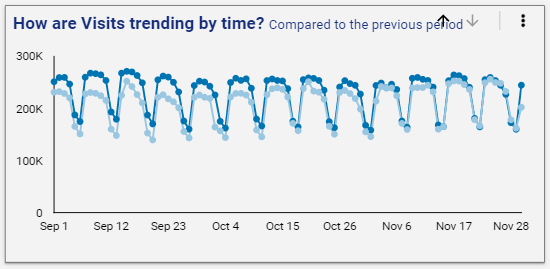
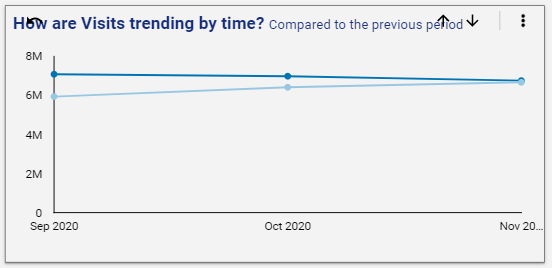
- Time frame filter - this is set to daily by default, however can be changed to monthly or yearly using the up and down arrows at the top right of each graph
You can further filter your results by clicking on a specific value in the tables and pie charts. For example, if on the Visitors report you would like to understand the trend for a specific city, you can click the city of your choice to have a filtered view.
- Metrics filter – some graphs and charts containing multiple metrics, e.g. Pageview and Sessions, have an optional metrics widget
 . Clicking on this allows you to choose which metrics to display.